sym x
print("printed first")
factor(x^4 - 1)
printed first\[\left(x - 1\right) \left(x + 1\right) \left(x^{2} + 1\right)\]
A cell shows, in order, what it printed and what it displayed, and then — if its last statement is an expression — the value of that expression, as a notebook does. A trailing ; suppresses the value.
sym x
print("printed first")
factor(x^4 - 1)printed first\[\left(x - 1\right) \left(x + 1\right) \left(x^{2} + 1\right)\]
expand((x + 1)^5);A value with a LaTeX form is shown as display maths. That covers every ER2 type and every SymPy expression; other values are shown as text.
Matrix([[1, x], [x, 1]]).det()\[1 - x^{2}\]
GF(9).gen()^4, NumberField(x^2 + 5).class_number()(2, 2)show() displays each of its arguments as maths, wherever it is called:
for k in range(1, 4):
    show(diff(sin(x)^k, x))
\[\cos{\left(x \right)}\]
\[2 \sin{\left(x \right)} \cos{\left(x \right)}\]
\[3 \sin^{2}{\left(x \right)} \cos{\left(x \right)}\]
An inline expression in prose is evaluated where it appears. It is shown as text, or as inline maths when it is latex(…):
The derivative of $\sin^3 x$ is `{er2} latex(diff(sin(x)^3, x))`.The derivative of \(\sin^3 x\) is \(3 \sin^{2}{\left(x \right)} \cos{\left(x \right)}\).
Every Matplotlib figure left open at the end of a cell is saved and shown, then closed: SVG for HTML, PDF for LaTeX and PDF output, PNG for everything else (fig-format overrides it). Matplotlib’s own return values, such as the list of lines plt.plot returns, are not shown.
import matplotlib.pyplot as plt
ns = range(1, 101)
plt.figure(figsize=(6, 3))
plt.bar(ns, [sigma(n) for n in ns])
plt.plot(ns, ns, color="black")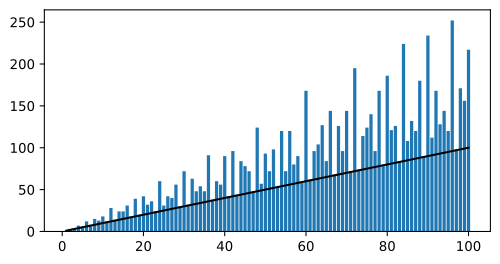
Figure 1 is numbered and cross-referenced like any Quarto figure.
freeze: auto or freeze: true store results in _freeze/, and the paths stored there are relative, so the cache can be committed and replayed elsewhere. Quarto honours freeze only when a whole project is rendered; quarto render one-file.qmd always executes.